Automated Business Reporting Dashboard for Small Business
Stop compiling spreadsheets every week. Learn how small businesses can build automated dashboards that show exactly what's happening in their business without manual work.
Quick question: Can you tell me right now how much revenue you made last week? Which marketing channel brought in your best customers? What your average response time is?
If you're like most small business owners, you probably had to think about it. Maybe you said "I need to check" or "I know it's somewhere."
Here's the problem with that feeling: You're making decisions based on what you think is happening, not what's actually happening.
There's a better way. Automated business dashboards can show you exactly what's happening in your business, updated in real-time, without you lifting a finger.
Why Most Small Businesses Fly Blind
Business owners know they should be tracking metrics. The problem is the work required to get them.
You've got data everywhere. Sales in your CRM, expenses in your accounting software, website traffic in analytics, marketing metrics in various tools, customer data in spreadsheets. None of these systems talk to each other.
So every week or month, you sit down and manually compile reports. Export from one system, format in Excel, copy-paste from another, adjust formulas, realize something doesn't match, troubleshoot, finally get a number that might be accurate.
By the time you're done, the data is already old. And next week, you get to do it all over again.
It's exhausting. So most business owners stop doing it. They check their bank balance, look at revenue, and trust their gut.
That works when you're small. But it breaks as you grow because you can't scale your gut feeling.
What an Automated Dashboard Actually Does
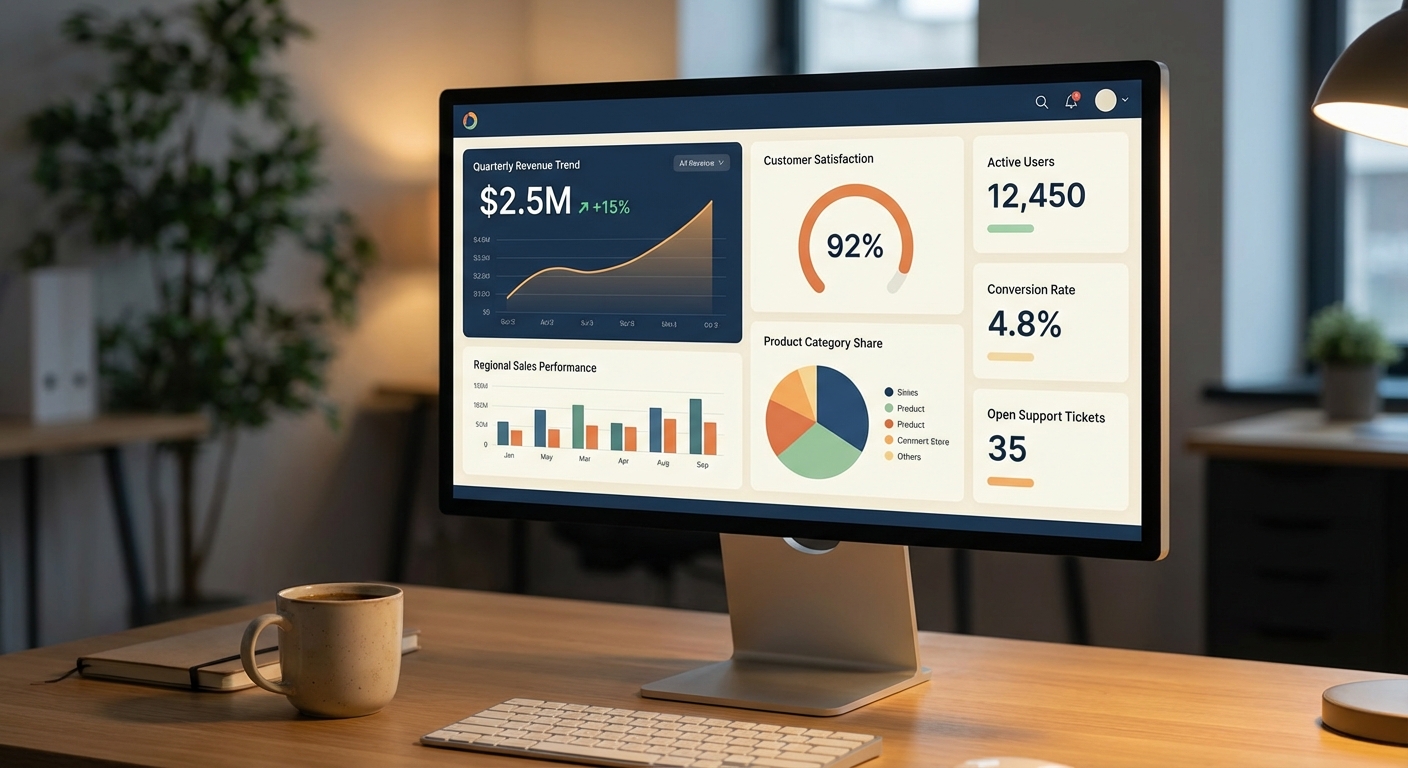
An automated business dashboard pulls data from your various systems and displays it in one place, updated automatically.
Here's what that looks like in practice:
Sales data flows from your CRM automatically. If you use Salesforce, HubSpot, Pipedrive, or even a simple Google Sheet tracking sales, that data pulls into your dashboard in real-time. No manual entry, no exporting and importing.
Financial data connects from your accounting software. QuickBooks, Xero, FreshBooks — whatever you use — feeds revenue, expenses, and profit into your dashboard automatically.
Marketing metrics pull from your ad platforms and analytics. Google Ads, Facebook Ads, Google Analytics — your spend, impressions, clicks, conversions show up alongside your revenue so you can see what's actually working.
Operational data integrates where it lives. Project milestones, customer tickets response times, inventory levels, appointment bookings — whatever you track can be included if it matters to your business.
The result: One screen that tells you everything you need to know, updated automatically, anytime you need it.
Dashboards Small Businesses Actually Need
You don't need hundreds of metrics. You need the right ones. Here's what most small businesses should track:
Financial Health: Revenue this month vs. last month, expenses, profit margin, cash on hand. These are your vital signs.
Sales Performance: New leads, closed deals, deal velocity, average sale value. Are you filling the pipeline and converting?
Marketing ROI: Spend by channel, leads per channel, cost per customer, which campaigns are actually profitable. Stop guessing where your money should go.
Customer Health: New customers, churn rate, customer satisfaction, support response time. Are you keeping the customers you acquire?
Operational Metrics: Whatever tells you if your business is running smoothly. Appointments booked, tickets resolved, inventory turnover, project on-time rate.
That's maybe 15-20 metrics total. Not hundreds. The ones that actually tell you if your business is healthy.
The Tools That Make This Possible
You don't need a data science team or expensive enterprise software. Small businesses have good options:
Google Looker Studio (formerly Data Studio): Free, connects to hundreds of data sources, genuinely powerful. The learning curve is manageable and there are templates available.
Microsoft Power BI: If you're already in the Microsoft ecosystem, this integrates well with Office 365. More complex than Looker Studio but very capable.
Tableau: The most user-friendly visualization tool, but significantly more expensive. Overkill for most small businesses unless you love data visualization.
All-in-one solutions: Some CRM and marketing platforms include built-in dashboards. HubSpot, Salesforce, Klipio — worth checking if you're already using them.
Here's the thing: You don't need perfect data on day one. You need the most important data, reasonably accurate, displayed clearly. That's enough to start making better decisions.
Building Your First Dashboard: A Practical Approach
Don't try to boil the ocean. Start simple and build from there.
Week 1: Connect your most important data source. For most businesses, that's your accounting software or CRM. Looker Studio has built-in connectors for both. Get your revenue or sales data flowing into a simple dashboard. Just a few key metrics to start.
Week 2: Add a second data source. Maybe it's your marketing metrics or your website analytics. Now you're starting to see connections between what you're spending and what you're earning.
Week 3: Identify the metrics that actually change your decisions. When you look at your dashboard each week, what numbers make you take action? Focus on those. The rest is noise.
Week 4 and beyond: Iterate. Add metrics that matter. Remove the ones that don't. Create views for different purposes — daily operational metrics, monthly strategic metrics, what your team needs to see vs. what you need to see.
The goal isn't the perfect dashboard. The goal is a dashboard that helps you make better decisions.
What Changes When You Have Real-Time Visibility
Here's what I've seen happen when business owners start using automated dashboards:
You catch problems early. Instead of discovering at the end of the month that revenue dropped 30%, you see it happening on day five. Now you can do something about it.
You stop wasting money. You can see exactly which marketing campaigns are profitable and which aren't. You don't need to guess where your budget should go.
You make faster decisions. No more waiting until you compile next month's report. The data is there whenever you need to make a call.
Your team stays aligned. Everyone sees the same numbers. No more "I thought we were supposed to be focusing on" conversations based on different perspectives.
You sleep better. There's real peace of mind in knowing exactly where your business stands, instead of carrying that vague anxiety that something might be going wrong.
The Honest Truth About Implementation
Setting up your first dashboard will take work. Connecting your data sources, figuring out which metrics matter, building the initial views — plan on 10-20 hours your first time through.
After that, it's maintenance. Maybe an hour or two per month once everything is running smoothly.
The math works out. If your dashboard saves you four hours of manual reporting work per month, you break even in 3-5 months. After that, it's pure time savings. Plus the value of having real-time data instead of stale reports.
And here's the thing: You can start small. One dashboard with five metrics is infinitely better than no dashboard at all. Build from there as you see what's valuable.
Common Misconceptions
"I don't have enough data for a dashboard." You have more than you think. Even if your business is new, tracking revenue, expenses, and a few key operational metrics is valuable.
"My data is too messy." It probably isn't as messy as you think. And even imperfect data displayed clearly is better than perfect data hidden in spreadsheets nobody looks at.
"Dashboards are for big companies." Actually, big companies are the ones drowning in data they can't use. Small businesses are the ones who benefit most from clarity.
"I'll do it when I have time." You won't. This is one of those initiatives that keeps getting pushed. The companies that implement it are the ones who decide to just start.
Getting Help With Your Dashboard
If you're thinking this sounds good but you don't know where to start, you're not alone. Most business owners know they should be tracking metrics better — they just need someone help them figure out what to track and how to set it up.
That's exactly what I do. I work with small businesses to identify the metrics that actually matter, connect their data sources, and build dashboards that give them real-time visibility into what's happening.
One strategy session. A few hours of implementation work. Ongoing support as you refine what works for your business.
You stop flying blind and start running your business with clarity.
Want to see what an automated dashboard could look like for your business? Book a free consultation and let's map out what metrics would move the needle for you.
Free: AI Readiness Checklist
Find out if your business is ready for AI automation. 10 questions, 2 minutes.